Introducing 3D fuel and fire modeling with BurnPro3D
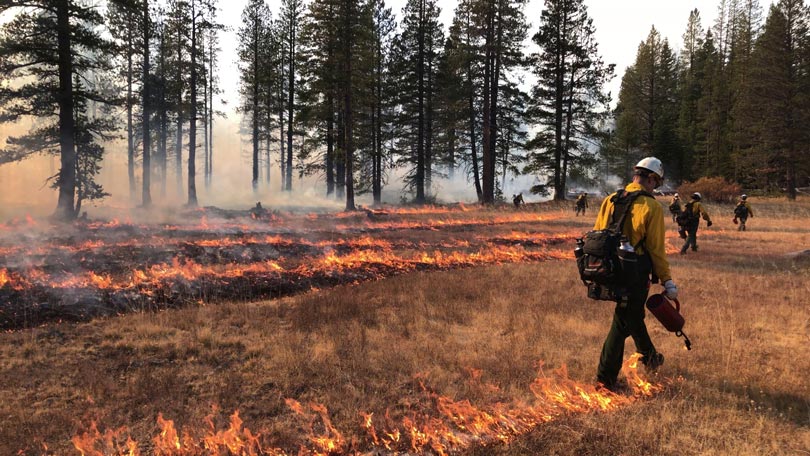
Welcome to the BurnPro3D intro session!
BurnPro3D is an online platform developed by UC San Diego that supports prescribed fire planning. The tool uses FastFuels 3D fuel models developed by USFS and the QUIC-Fire coupled fire/atmosphere model developed by Los Alamos National Lab to simulate prescribed fires in 3D. This session will show you the data that powers BurnPro3D and introduce you to next-generation fire modeling.
After this session, you can register for your own BurnPro3D account here.
Takeaways:
This session will help you:
- Understand 3D fuel and fire modeling
- Create fire simulations that inform your work
Independence Lake
Independence Lake is a natural glacial lake in the Sierra Nevadas at an elevation of 6,949 feet in the upper reaches of the Truckee River basin.The data visualized here uses terrestrial and aerial LiDAR scans collected at the site in collaboration with IntELiMon, led by USGS. The scanners gathered hundreds of millions of points of data, which can be used to build a 3D representation of the fuels to hand off to the fire model.
Points2Pano
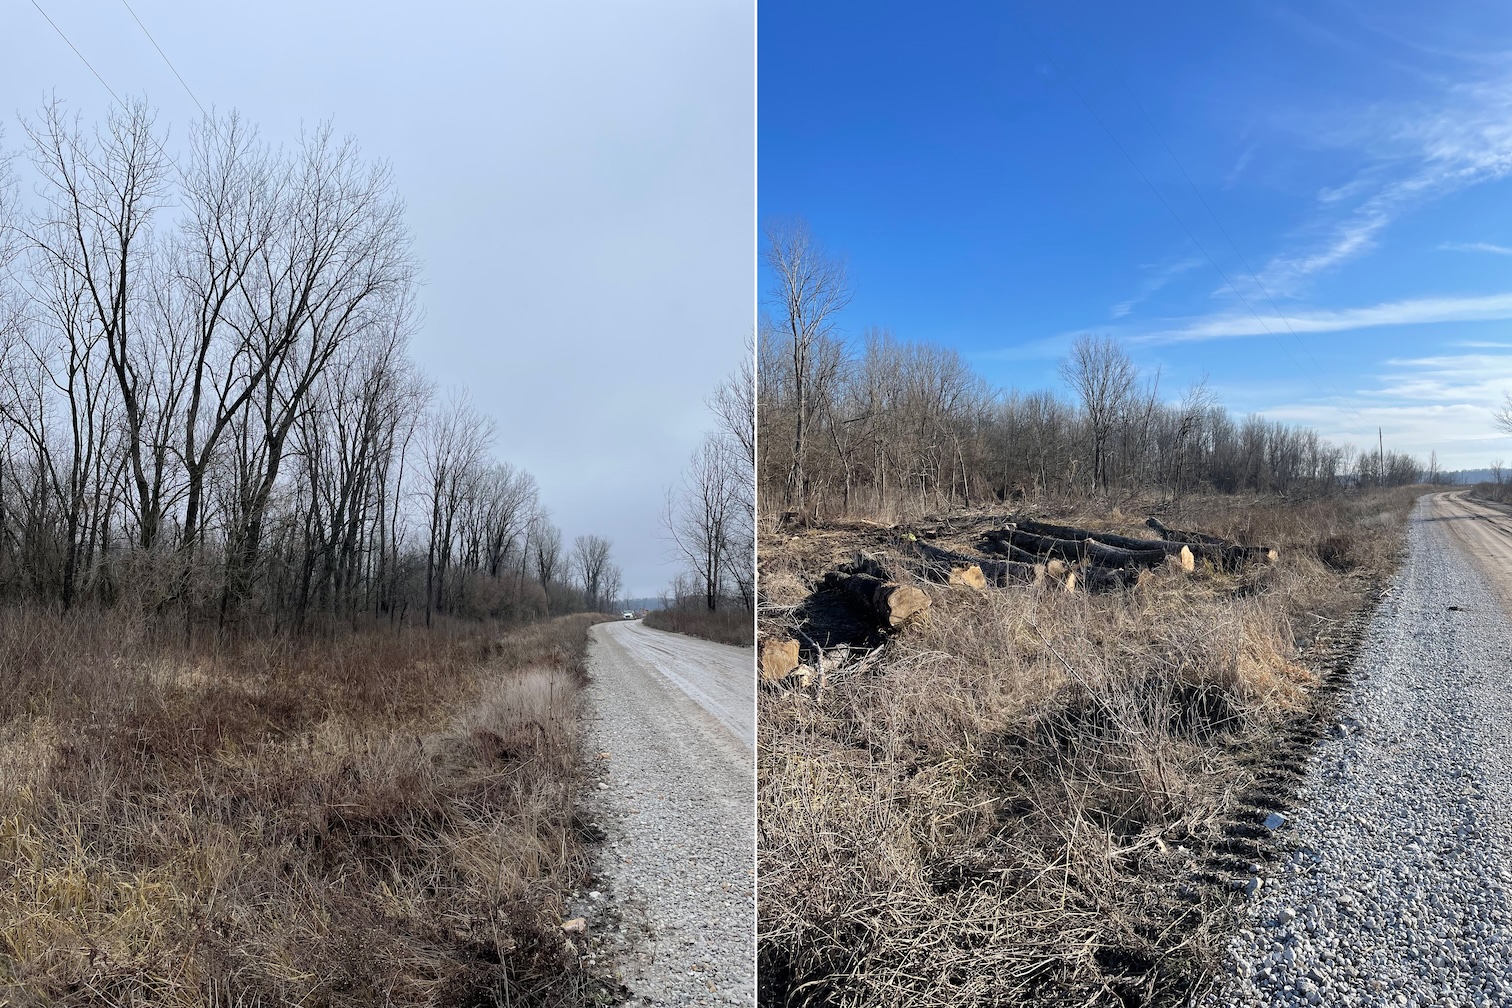
Points2Pano is available on your phone and lets you visualize the panoramic images of IntELiMon terrestrial LiDAR scans across thousands of sites. This data can be used to share pre- and post-burn visualizations of burn units and inform fire modeling in BurnPro3D.
Burn Unit Run Through
When terrestrial and aerial LiDAR scans are stitched together, they provide an immersive experience of a burn unit. Millions of points of scientific data can be used for training, decision-making and public communication.
Burn Units
You start modeling in BurnPro3D by providing the boundary of your burn unit. Once you select the burn unit where you would like to model a burn, a site-specific 3D model of fuels will be created for that location. Explore the shapefiles provided at Independence Lake.
Scroll to zoom · Drag to pan · Right-click drag (or Ctrl + drag) to tilt & rotate
Independence Lake Burn Unit
Scroll to zoom · Drag to pan · Right-click drag (or Ctrl + drag) to tilt & rotate
FastFuels 3D Fuel Tiles
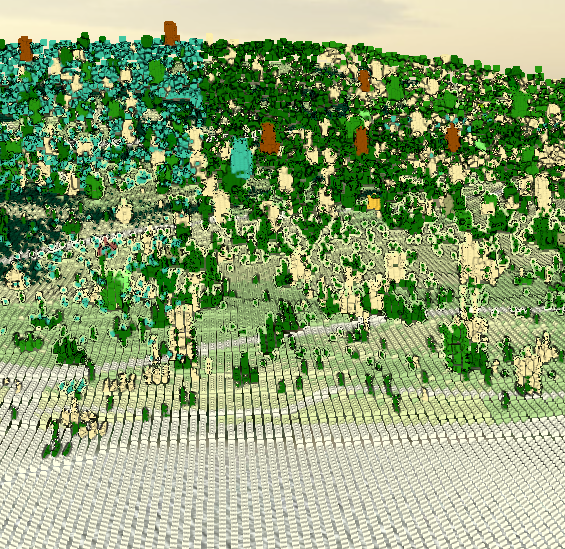
A 3D fuel tile is a high-resolution, three-dimensional digital representation of fuels. FastFuels builds a 3D, high resolution fuel tile using national datasets combined with site-specific data where available. This serves as a key input for QUIC-Fire to accurately simulate how a prescribed fire will move through a burn unit given the season, fire environment, and ignition pattern specified by the burn planner. Before moving on to modeling scenarios, please explore the fuel tile for this burn unit.
Scroll to zoom · Drag to pan · Right-click drag (or Ctrl + drag) to tilt & rotate
The viewer starts in a bird's-eye view — zoom in and tilt to see the voxel grid and explore the fuel tiles in 3D.
Scroll to zoom · Drag to pan · Right-click drag (or Ctrl + drag) to tilt & rotate
Fuel Consumption
BurnPro3D outputs surface, midstory, and canopy fine fuel consumption.
- Surface Fuels — consumption of leaf litter, 1-hour fine dead fuels, and grasses. These fuels are primarily driving the fire spread.
- Midstory — consumption of fine fuels for the shrubs, saplings, and other ladder fuels from 1m above the ground surface to the canopy base height. Canopy base height is set by the user. The layer connects the surface and canopy fuels and influences the potential for vertical fire spread.
- Canopy — consumption of live foliage and small twigs in the aerial space above the midstory. Consumption in this layer indicates where the prescribed burn had enough intensity to affect the canopy.
In BurnPro3D, users are able to select fuel-consumption objectives for each layer. BurnPro3D then reports the consumption as the percentage of how much fuel was removed in the surface, midstory, and canopy layers, along with the environmental conditions that produced those outcomes.
BurnPro3D also provides spatial maps of surface fuel consumption, which reveal the variability in consumption across the surface as a result of variations in surface fuel load, ignition pattern, or environmental conditions. These maps also highlight areas with lower consumption or potential areas for slopovers that could occur during a prescribed burn.
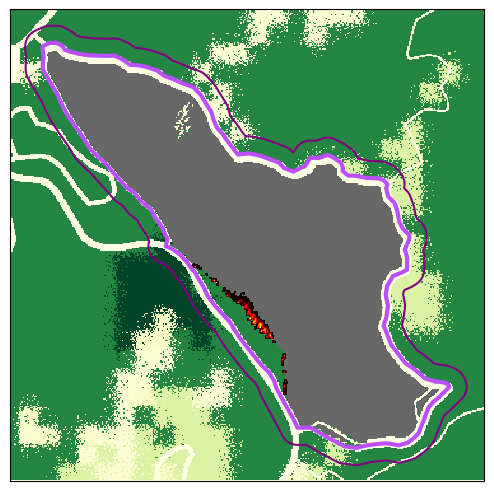
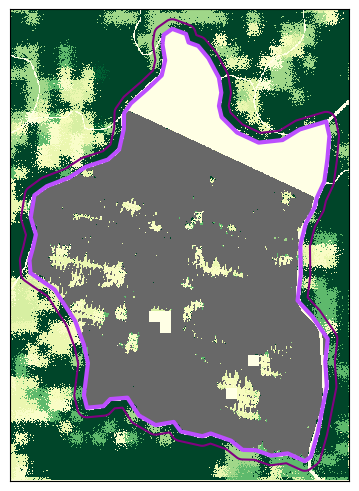
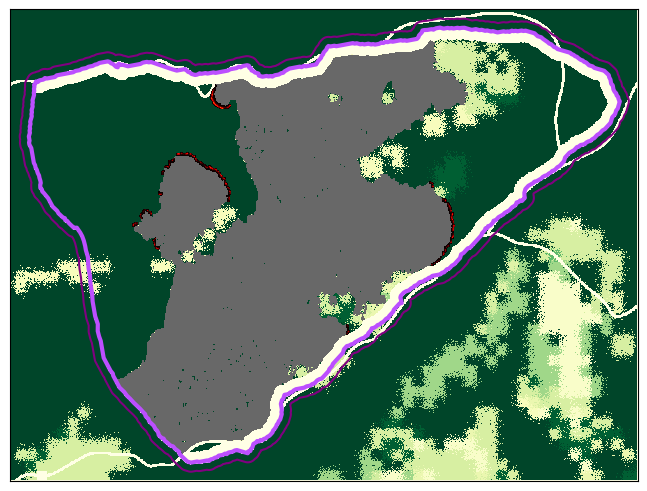
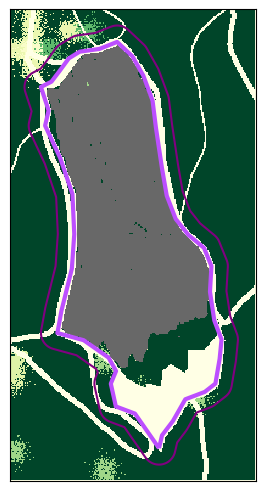
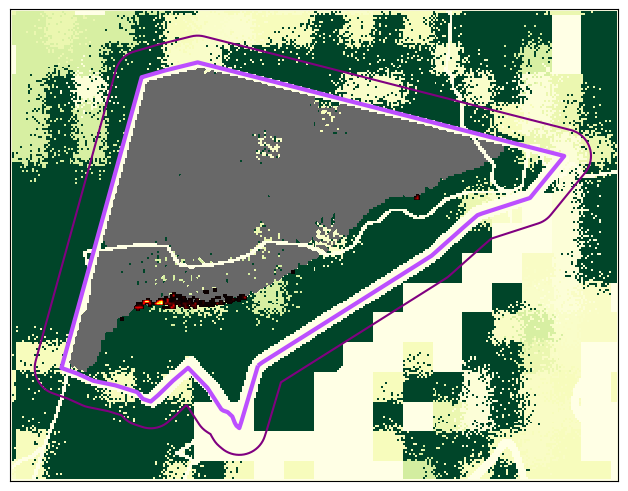
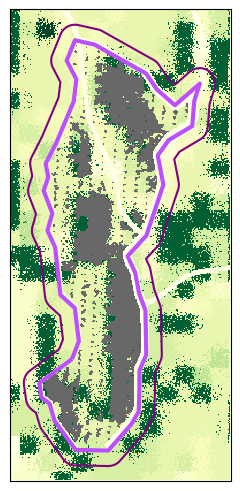
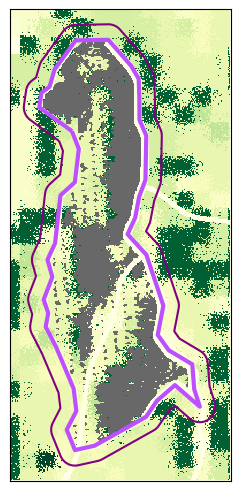
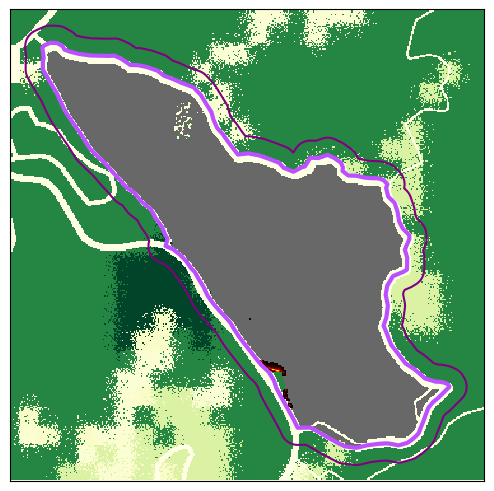
By showing how much fuel remains after the simulated burn, BurnPro3D helps practitioners evaluate whether their planned ignition operations and environmental conditions are likely to meet management objectives. However, these outputs should be interpreted with caution as there are some key limitations with the model. The model uses uniform and constant fuel moisture throughout each simulation, which means that the consumption results represent idealized fire-behavior conditions. Synthesizing the ensemble results across multiple simulations with different fuel moisture inputs is important to capture any potential variability. Similarly, the use of the constant wind speed and direction throughout the simulation simplifies the real patterns of fire behavior and should be considered when applying the model results to operational planning.
BurnPro3D Simulations
Find the scenario that achieves a surface fuel consumption over 70%.
Select a season, fire environment, and ignition pattern, then run the fire simulation to see if your prescription meets the objectives.
Step 1 — Fire Environment
Winds are from the Southwest (225 degrees).
Step 2 — Season
Step 3 — Ignition Pattern
Congratulations!
You've completed the BurnPro3D training.
What You've Learned
- How QUIC-Fire models fire behavior in three dimensions
- How burn area and 3D fuels structure are represented
- How environmental conditions influence fire spread
- How ignition patterns affect prescribed fire outcomes
- How to interpret fuel consumption outputs and compare scenarios
You're Ready for BurnPro3D
You now have the foundational knowledge to use BurnPro3D to plan, evaluate, and compare prescribed fire outcomes. Apply what you've learned to make more informed decisions in the field.